For format prints left nodes first.
The rules are expressed in terms of the standardized units.
For example, the three node tree above may
be depicted as:
Bayesian CART by Chipman, George, and McCulloch
To download the executable .exe file click here: CGMIidCART.exe
To download the papers (pdf) : Bayesian
Treed Models, Bayesian Cart Model Search
Extracting Representative
Tree Models from a Forest, Hierarchical Priors for Bayesian CART Shrinkage
The .exe file was created with the Microsoft Visual C++ compiler version 6.
It should run on any NT machine or with windows after 95.
The .exe expects an input file in the same directory named CartData.txt.
It creates several output files.
Format of the input file:
To download an example input file: CartData.txt.
You can test things by downloading CGMIidCART.exe and CartData.txt,
putting them in the same directory, and then double clicking on CGMIidCART.exe.
Here is the example input file CartData.txt (there
are two ordered x's and y is binary so it is treed logit):
2
100
0.5 1 10 0.404
1000 500 2
1
1
2
1 1
1 1
1 1
.000001 .000001
-99
20
1000 0
-0.272493234072922 -0.106484230954447 0
2.60915459183606 0.0393655272663769 1
-1.83035757366366 -0.931472702226514 1
-0.2591994764855 -0.460579715457022 0
1.61583321133611 -0.916427616159501 1
-0.643645705463612 1.33251377524322 0
...
...
Line 1: 1 if you want to run treed linear regression, 2 if you want to
run treed logit
Line 2: number of iterations skipped between print statements
Line 3: the first two numbers are the base and power parameters for the tree prior.
The second two numbers specify the form of the conjugate prior for end node models.
See "Bayesian Treed Models" for discussion of these parameters for treed linear regression.
For treed logits, the second parameter (fourth on the line) does not matter and
the first parameter (third on the line) is the prior standard deviation of the coefficients
(the x's are standardized as discussed in "Bayesian Treed Models").
Line 4: number of prior draws, number of iterations for the metropolis algorithm, number of restarts for the chain
Line 5: Number of dependent variables (for now this is always 1)
Line 6: for each dep var: 1 if var is ordinal, 0 if categorical (for now, this does not matter)
Line 7: number of independent variables
Line 8: for each indep var: 1 if var is ordinal, 0 if categorical
Line 9: for each indep var: 1 if used in tree, 0 else
Line 10: for each indep var: 1 if used in end node model, 0 else
(note: an intercept is automatically added)
Line 11: for each indep var: the minimum distance between values used in splitting rules.
For ordinal regressors the choice of possible split values is based on the sorted unique
values found in the data. We use these values except that they have to be at least the
minimum distance apart. If you put a very small value for the minimum distance then
all unique values for the variable in the data set will be considered as potential split values.
If you put 0, a default is used.
For categorical variables all unique values are used so the parameter given on
this line is ignored.
Line 12: seed for rand number generator (taken from numerical recipes in C)
Line 13: the size of the largest tree which is kept and printed out (see TreeOut.txt)
Line 14: n1 = number of training observations, n2 = number of test data observations
The rest of the file has the data with each row being on observation.
The dependent variable must be the last column.
The first n1 observations are used as data, and the predictions are
made using the the last n2 rows so you can see how it works out of sample.
Note: there is no error checking so if you make a mistake setting up the file
the program will crash !!
Output Files:
TreeOut.txt:
For each tree size up to the max (see line 13 of the input file)
the tree with the largest LIL (log integrated likelihood) out of all trees visited of
that size is printed out. The best overall tree is printed out first.
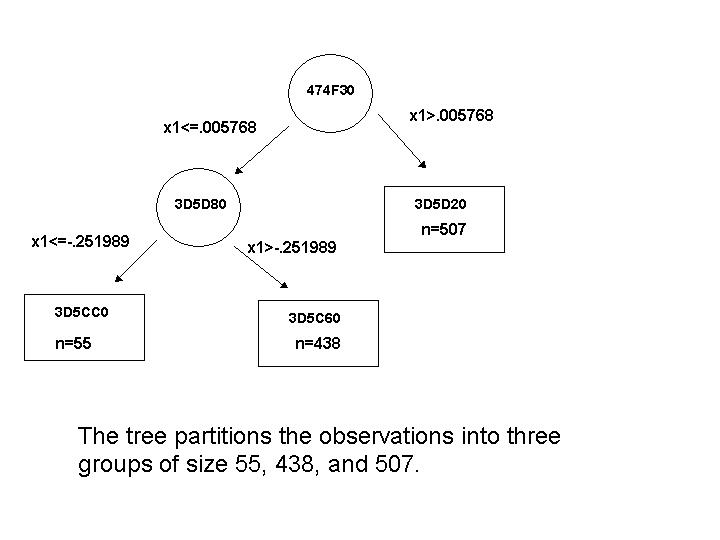
For example, the TreeOut.txt file resulting from the input file above is:
best

ll is -611.747043, on outer 1
node:310300 n:1000 TBN: 101 Avail:11 Var:1 ORDRule:(475)=-0.001029
 node:3C81C0 n:476 TBN: 010 Avail:11parent:310300
 node:3C8160 n:524 TBN: 010 Avail:11parent:310300


best of size 2, has LL -611.747043, on outer 1
node:474EFC n:1000 TBN: 101 Avail:11 Var:1 ORDRule:(475)=-0.001029
 node:3B8FC0 n:476 TBN: 010 Avail:11parent:474EFC
 node:3B8F60 n:524 TBN: 010 Avail:11parent:474EFC


best of size 3, has LL -613.181808, on outer 1
node:474F30 n:1000 TBN: 100 Avail:11 Var:1 ORDRule:(492)=0.005768
 node:3D5D80 n:493 TBN: 001 Avail:11parent:474F30  Var:1 ORDRule:(55)=-0.251989
  node:3D5CC0 n:55 TBN: 010 Avail:11parent:3D5D80
  node:3D5C60 n:438 TBN: 010 Avail:11parent:3D5D80
 node:3D5D20 n:507 TBN: 010 Avail:11parent:474F30
For format prints left nodes first.
The rules are expressed in terms of the standardized units.
For example, the three node tree above may
be depicted as:
Results are calculated for two trees
found:
The "Best" results correspond to the tree which has the
highest
overall LIL of all those visited.
The "MostVisited" results
correspond to the tree with the most
probable size (roughly speaking).
It is found by looking at the restart
that generated the "Best" tree.
We find the most frequently occuring
tree size in this one run. The
"MostVisited" tree has highest LIL
among all trees of the most frequently
occuring size.
The idea is that the best tree may be too big and size
visited
most often may reflect the true posterior model
size.
Using the "MostVistited" results is
recommended.
The first column is the fitted values for the training data.
The second column indexes the bottom node (the partition)
of the corresponding observation.
(Best, MostVisited)TestFits:
Same as TrainFits, but for the test data.
(Best, MostVisited)Estimates:
The ith row gives the parameter estimates for the
training data in the ith bottom node.
For linear regression, the first number in a row corresponds to the intercept,
the last to the error standard deviation, and the the ones inbetween to the
coefficients in the order the appeared in the data.
For logit, it is the same except that there is no standard deviation parameter.
For the example data, here is a scatter plot of (x1,x2 standardized) vs. the
fitted values (which are probabilities since the example is treed logit) from
the two node tree:
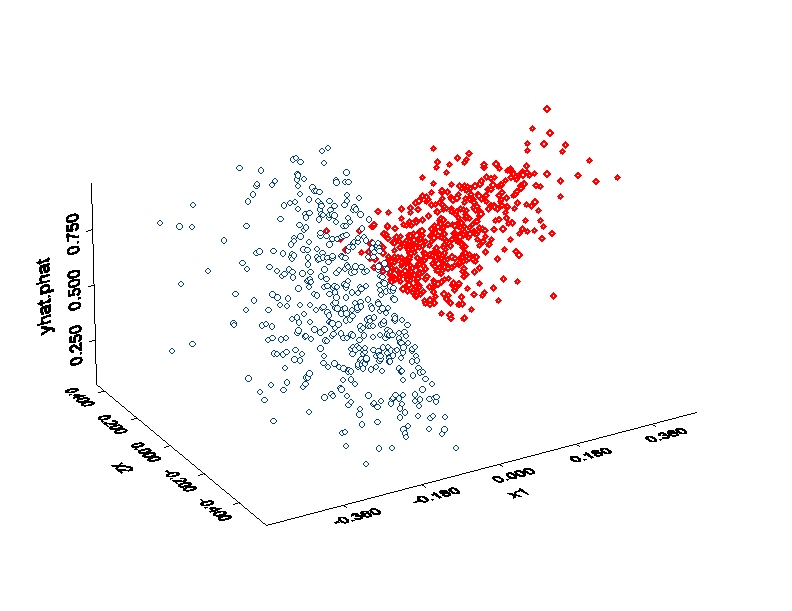
The observations from node 2 are in red.
This was simlulated data.
Boston Housing Data
In "Bayesian Treed Models" we use the well known
Boston housing data.
This is the CartData.txt input file for running the example: CartData.txt
This is an annotated version of the file with
comments describing the
choices made: annotated version.