Machine Learning/Statistical Learning, Fall 2019
Course Information
Course Name:
Machine Learning / Statistical Learning:
Instructor/TA:
Instructor: Robert McCulloch, robert.mcculloch@asu.edu
, office: Wexler 528
TA:
494: Xuetao Lu, xuetaolu@asu.edu
598: Xiangwei Peng, Xiangwei.Peng@asu.edu
Time and Place:
STP 598
Topic: Machine Learning / Statistical Learning
92203 McCulloch T Th 1:30 PM 2:45 PM Tempe - College Avenue Commons RM: 359 08/22 - 12/06(C)
STP 494
Topic: Machine Learning / Statistical Learning
92204 McCulloch T Th 3:00 PM 4:15 PM Tempe - COOR186 08/22 - 12/06(C)
Syllabus
Syllabus
Office hours: Thursday, 4:30-5:30, Wexler 528.
Final Project
final due date: 9am, December 12.
see the sample projects below.
A project should be about 8 pages:
- Introduction, clearly outline the goal of the study
- Data and Plan, what data are you using, what is the overview of your approach
- results: nice graphs, nice tables
- conclusion: brief, concise.
Write it up nicely, e.g. use Rmarkdown or Jupyter notebook !
You can do anything you want !!!
Our course covers the core methods but there is a lot of other stuff out there!!
The simplest thing to do (which is great!) is get yourself a y and x which are interesting
and carefully try some of our key methods on it. Carefull means look at the out-of-sample
predictive performance
and have some nice tables/graphs conveying the results.
If you are stuggling to get a project going, just do the drug discovery data:
A nice project option is the drug discovery data I used in ``BART: Bayesian Additive Regression Trees''.
The data is on Rob's data page: rob's data page.
Here is the BART paper where we used the Drug Discovery data, see section 5.3:
BART paper
Folks note this seminar on p-values, Friday November 22 at noon: Discussion of the March 2019 Special Issue of The
American Statistician on Alternatives to P < .05
Homework
Here are instructions for how to submit homework using canvas: how to submit
Make sure you include each group members name clearly and whether they are registered
for 494 or 598.
Homework 1, due September 17, same for 598/494: Homework 1
Homework 2, due October 8, same for 598/494: Homework 2
Homework 3, due November 5, mostly the same for 598/494: Homework 3, pdf
Homework 4, due November 26, same for 598/494: Homework 4
A little python for hw4: hw4.py
Homework 5, due November 26, same for 598/494: Homework 5
Homework 6, due ??, same for 598/494: Homework 6
Notes
Readings:
Chapter 2 of either ISLR (Introduction to Statistical Learing)
and/or Chapter 2 of ESL (Elements of Statistical Learning)
would be helpful for the first two sections of notes.
But just kind of skim, you don't need to understand everthing in these
chapters at this point.
Note: I will sometimes give you the R code I used to make the notes.
In the R code, I use the following files of simple R functions:
robfuns.R
rob-utility-funs.R
mlfuns.R
lift-loss.R (simple lift functions and deviance loss)
So, I might have the line source("../../robfuns.R") near the top of a script.
Simply replace the ../../ with the correct path to where you have put the file.
You may also see source("notes-funs.R").
This is just to write stuff out in a way I can easily pop into a latex script.
It just has one function printfl which you can replace with a simple R print.
For completness here is the file:
notes-funs.R
Note that often my scripts are designed so that if you set dpl=FALSE at the top,
then you can just source the script and the whole thing will run.
If dpl=FALSE then printfl is just print.
This setup may look weird, but the scripts are actually designed to run in batch mode.
Probability Review and Naive Bayes
Simple Illustration of Naive Bayes on the sms data (pdf),
Simple Illustration of Naive Bayes on the sms data (Rmd)
This an ascii R script where I play around with the Naive Bayes text analysis in more detail:
naive-bayes_notes.R
This is a python script to do Naive Bayes with the Ham/Spam data given the train/test split:
do_Naive-Bayes_Ham-Spam.py
KNN and the Bias Variance Tradeoff
R script to illustrate the bias-variance tradeoff
Simple R code to do cross validation: docv.R
Simple R code to get fold id's for cross validation
Python code to replicate what is the notes for the Boston example using sklearn
Note:
Both ESL and ISLR have an introductary overview chapter 2 in which general ideas are discussed,
then do regression and some other basic models and then later
discuss the practial (e.g. cross validation) and theoretical (e.g MLE) ideas
(ISLR Chapter 5, ESL Chapters 7 and 8).
I would encourage you do ``skip ahead'' and read/skim the discussion of cross-validation (and other topics).
More Probability, Decision Theory, and the
Bias-Variance Tradeoff
MLE and Optimization
MLE and a little optimization, 494
MLE and a little optimization, 598
Introduction to Bayesian Statistics:
Introduction to Bayesian Statistics and the Beta/Bernoulli Inference
Introduction to Bayesian Regression
Bayesian Regression and Ridge Regression
Regularized Linear Regression:
Linear Models and Regularization, 598
Linear Models and Regularization, 494
Properties of Linear Regression
Properties of Linear Regression (.Rmd)
R script to illustrate all subsets regression is package leaps
R script for ridge and lasso using glmnet, Hitters Data.
R script for reading in diabetes data and looking at y.
R script for Lasso on Diabetes.
R script for comparing Lasso,Ridge,Enet.
R script for forwards stepwise on Diabetes.
do-stepcv.R: R functions for doing stepwise.
R script to learn about formulas and model.matrix
(see Chapter 11, Statistical models in R, in the R-introduction Manual)
Note: AIC and BIC can be confusing. You can see different versions of the formulas.
Since you pick the smallest one, versions that differ by a constant are all correct.
This discusses things correctly and tells you how it works in R:
Cp, AIC, BIC or
the web link .
This link shows how confused the AIC vs. BIC discussion is:
AIC vs. BIC
R script for seeing Ridge vs Lasso in simple Problem.
R script for plotting Ridge and Lasso shrinkage (thresholding function).
R script to see Lasso coefs plotted against lambda.
R script to see Ridge coef plotted against lambda.
Regularized Generalized Linear Models ) (598)
Regularized Logistic Regression (494)
R script for Regularized logit fit to simulated data.
R script Lasso fit to w8there data.
R script Ridge fit to w8there data.
Classification Metrics
fglass.R: script using the forensic glass data
tab.R: script using the tabloid data
Trees
tree-bagging.R
knn-bagging.R
boost-demo.R
R package for plotting rpart trees
Single Layer Neural Nets
Single Layer Neural Nets (R code)
Single Layer Neural Nets XOR (R code)
plot.nnet.R
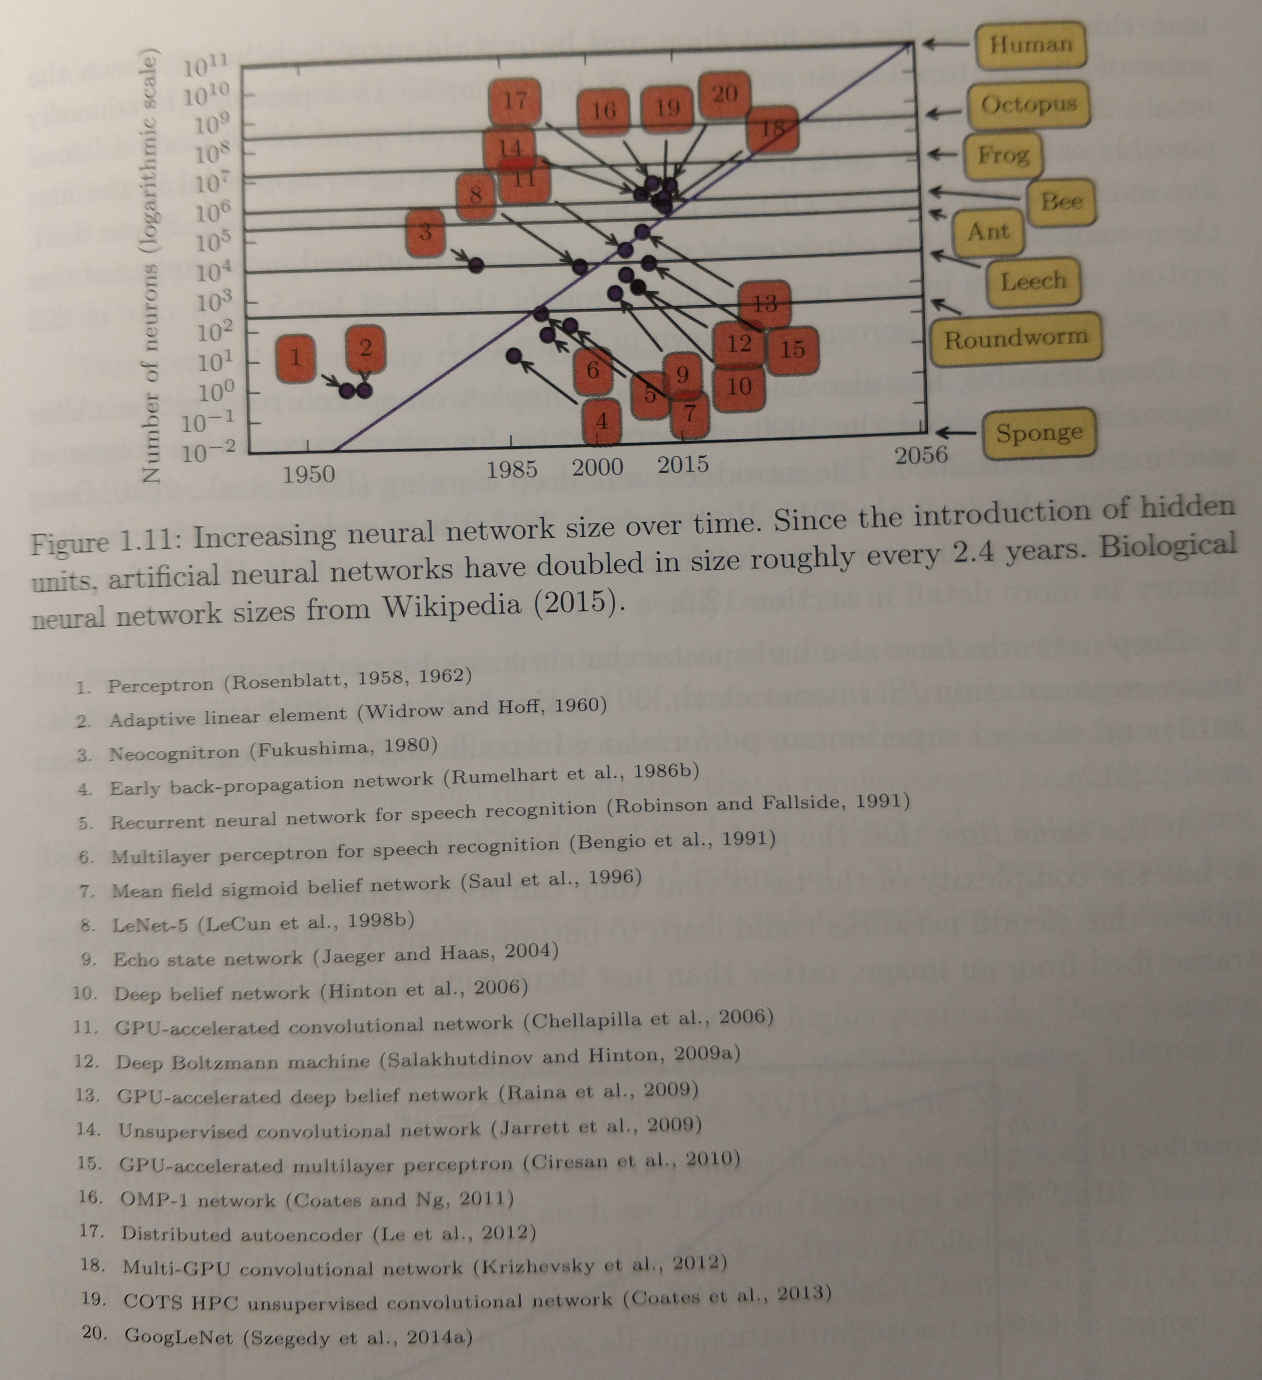
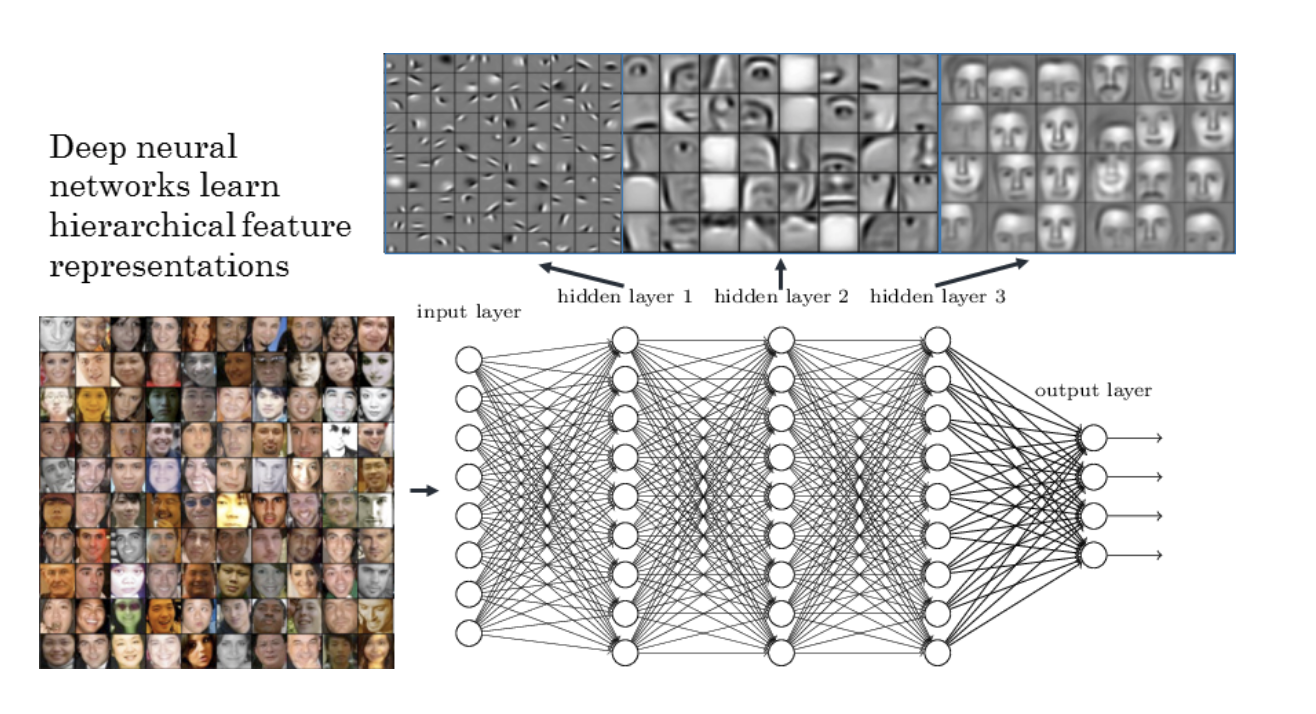
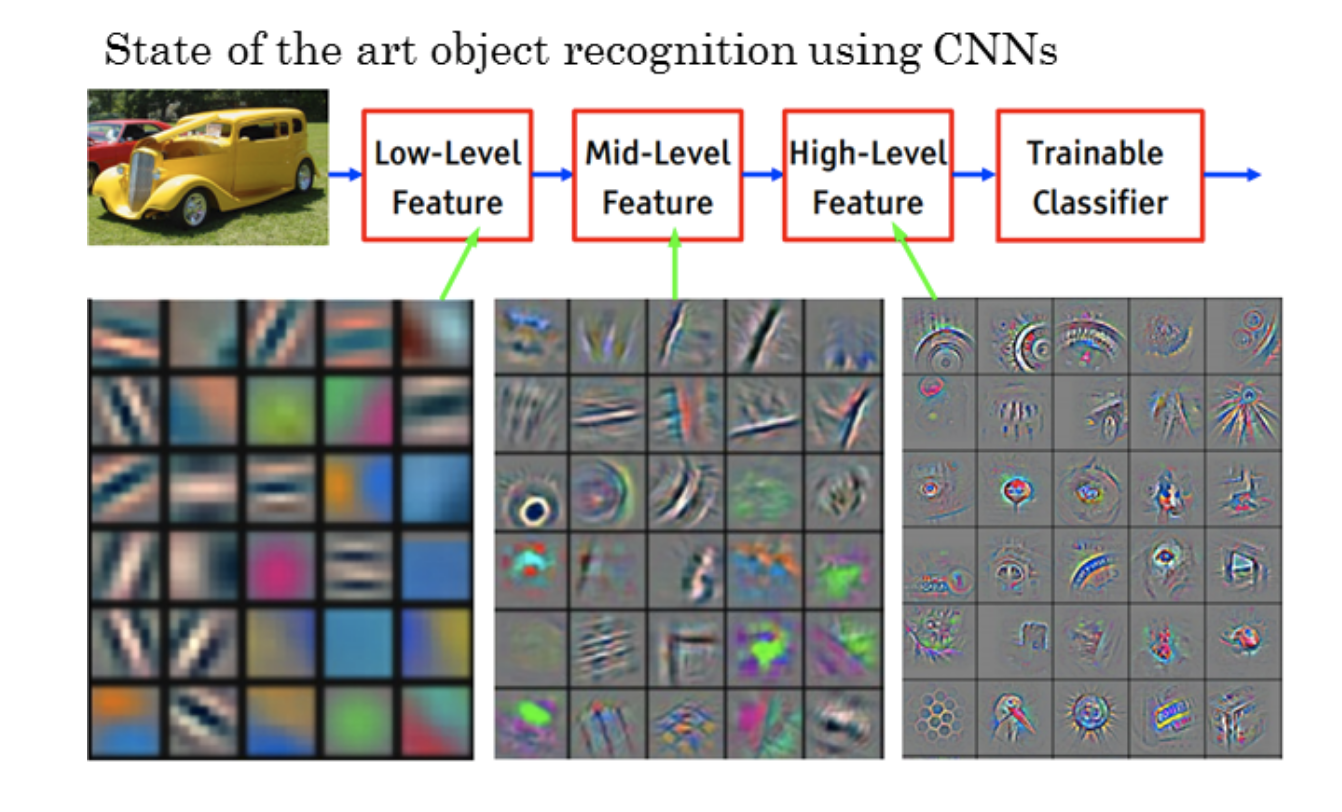
Deep Neural Nets
Backpropagation
Good discussion of Back-prop
Nice website with an overall discussion and pictures of the uncovered features
Nice visualization of a neural network
Nice tutorial on NN in R and the neuralnet R package
h2o
h2o : click on latest stable release
The R install instructions from the above link
Install h2o (and links to documentation)
h2o in R tutorial
Github for Darren Cook book on h2o
R examples h2o
Simple Example R script for Deep Neural nets in h2o
Similar to the simple script but done in Rmarkdown
the Rmarkdown
Do XOR with h2o and Deep Learning
Do Tabloid with h2o and Deep Learning
yet another version of lift code
deviance loss
Visualize MNIST digits
Fit MNIST digits
R examples keras
See "Deep Learning with R", by Chollet and Allaire.
Note that "Deep Learning with Python", by Chollet is a parallel book.
simple example of R package magrittr used in keras to pipe
keras_simple-Boston-lstat.R
Clustering: Hierarchical and K-means
Dimension Reduction: Principal Components and the Autoencoder
Latent Dirichlet Allocation
R
Information on R
Python
Information on Python
Sample Projects
A nice project option is the drug discovery data I used in ``BART: Bayesian Additive Regression Trees''.
The data is on Rob's data page: rob's data page.
Here is the BART paper where we used the Drug Discovery data, see section 5.3:
BART paper
Some old projects:
Predicting Soybean Yield (pdf)
Predicting Soybean Yield (Rmd)
Drug Discovery Data
Credit Card Fraud
Autoencoder on the MNIST Data
Data
Rob's Data Web Page
Sources for example data sets:
This has many data sets collected from different R packages but smallish n and p:
R data sets
Note:: this copied from page 34 of
``Hands-On Machine Learning with Scikit-Learn and TensorFlow'' by Geron.
UC Irvine Machine Learning Repository
Kaggle Data Sets
Amazon's AWS datasets
Meta Portals
dataportals.org
open data monitor
quandl.com